
Project · Academic

Predicting Negative Reviews in the Olist Ecosystem
An integrated approach to Business Intelligence and Machine Learning. This was my capstone for the Curso Superior de Tecnologia em Banco de Dados at PUCRS, for the discipline Projeto em Business Intelligence e Analytics: an end-to-end pipeline that takes the public Olist e-commerce dataset and predicts which orders are headed for a negative review — and, more importantly, says why.
The question
Brazilian e-commerce moved R$204.3 billion in 2024. In marketplaces like Olist, customer dissatisfaction is a direct risk to lifetime value — through negative reviews and tacit churn — so anticipating at-risk orders becomes a measurable operational advantage. The research question:
Which operational, logistical, and financial factors carry the most statistical weight in determining a negative review in Brazilian e-commerce?
What I built
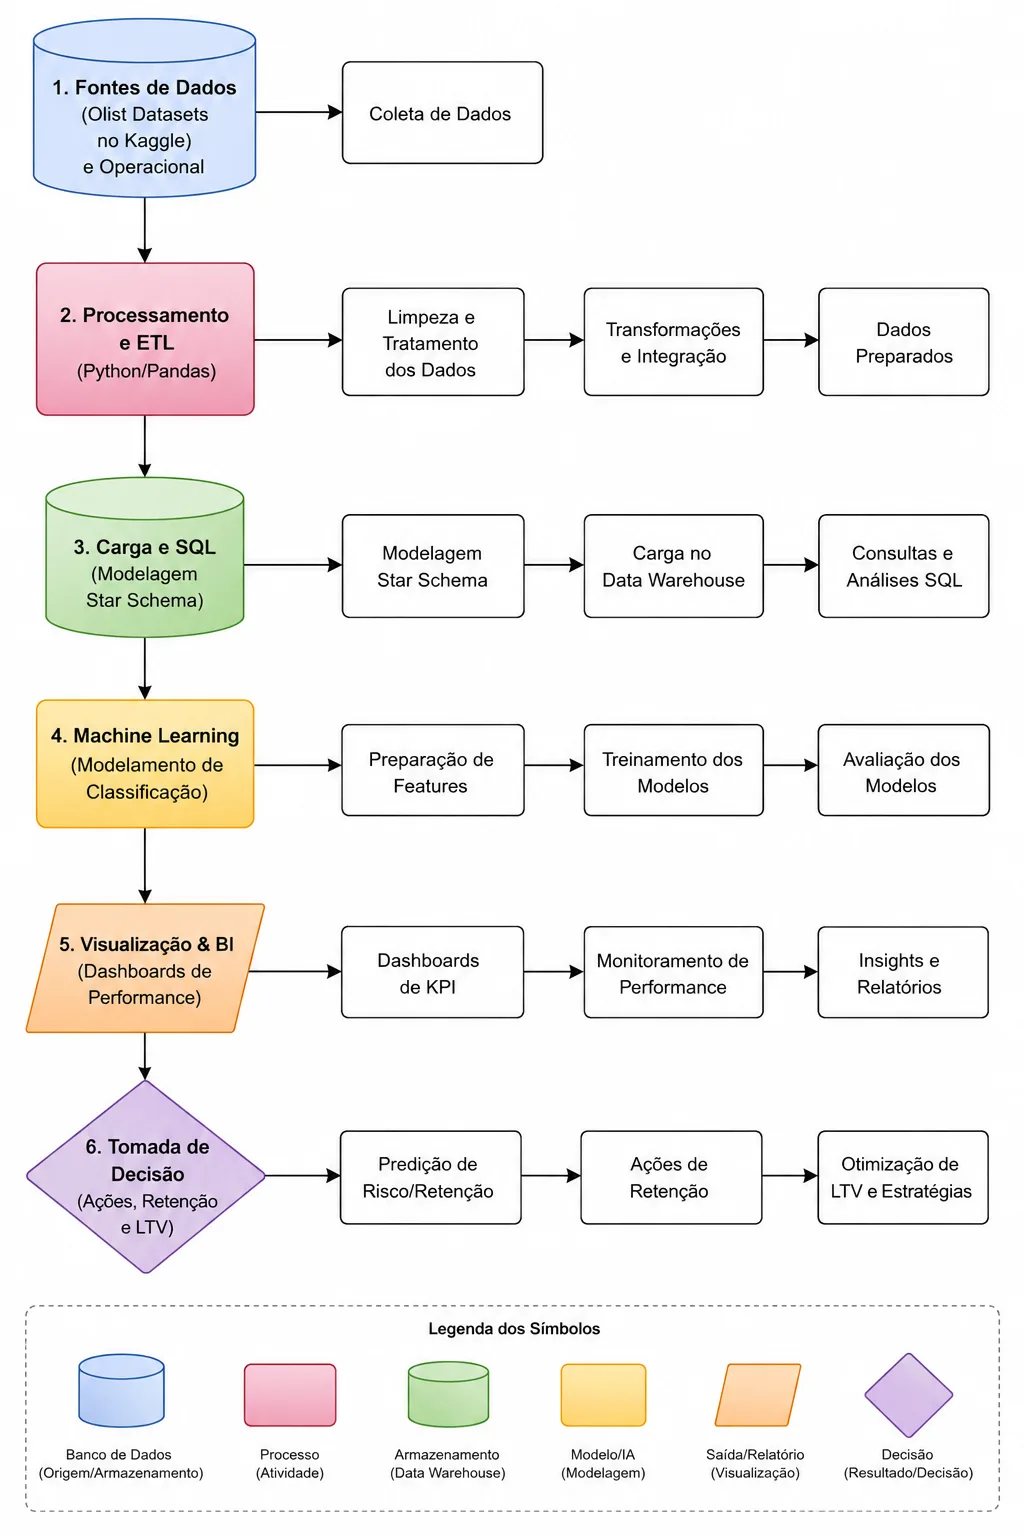
A six-layer, cloud-native, zero-cost pipeline following CRISP-DM. Raw Olist CSVs are cleaned and feature-engineered in a Python/Pandas ETL, loaded into a SQLite star-schema warehouse (one fact table, five dimensions), then split into two branches: a BI branch that renders four interactive Plotly dashboards, and an ML branch that trains and evaluates the predictive models — all reproducible from the same warehouse.
Three hypotheses, tested against the data
- H1 — Delivery delay (confirmed, by a wide margin). Late orders carry a 73.3% negative-review rate versus 17.3% for on-time ones. The three delay-related features alone account for ~52% of the Random Forest's importance.
- H2 — Freight on low-ticket items (confirmed). It isn't absolute freight but freight relative to price: the freight/price ratio averages 0.57 on low-ticket orders versus 0.11 on high-ticket ones. The second driver of dissatisfaction.
- H3 — Multi-vendor orders (partially confirmed). Multi-seller orders show a 3× higher negative rate (60.5% vs 20.5%), but the proposed causal channel was refuted by the data: multi-vendor orders actually consolidate faster (1.38 vs 2.30 days). Strong association, real mechanism still open — and I reported it as such.
The model
Binary classification on review_score <= 3, with Logistic Regression as a baseline and Random Forest as the main model (80/20 stratified split, balanced class weights). The trade-off is honest: Random Forest wins on accuracy and precision, Logistic Regression on recall.
| Metric | Logistic Reg. | Random Forest |
|---|---|---|
| Accuracy | 0.755 | 0.789 |
| Precision | 0.426 | 0.498 |
| Recall | 0.470 | 0.398 |
| F1-score | 0.447 | 0.442 |
| ROC-AUC | 0.698 | 0.702 |
Run as live inference, the model separates profiles cleanly: a low-risk order (early delivery, high ticket, light freight, single-vendor) scores a 37.3% chance of a negative review; a high-risk one (12 days late, low ticket, heavy freight, multi-vendor) scores 74.7% — a 37.5-point spread that makes real-time preventive churn monitoring viable.
Interactive dashboards
Four standalone Plotly dashboards, hosted on GitHub Pages — open them straight in the browser:
- Dashboard 0 — Executive viewKPIs, time evolution, score distribution
- Dashboard 1 — Hypothesis 1: delays & satisfactiondelivery delay vs negative-review rate
- Dashboard 2 — Hypothesis 2: freight vs price on low ticketfreight/price ratio by ticket band
- Dashboard 3 — Hypothesis 3: multi-vendor orderssingle vs multi-seller negative-review rate
Project documents
What it demonstrates
End-to-end data work across the stack: ETL and feature engineering, dimensional modeling (star schema in a SQLite warehouse), BI and data visualization (Plotly), supervised machine learning (model selection, evaluation, feature-importance reading), statistical hypothesis testing, and the business framing that ties it together — KPIs, churn, and lifetime value — all under a CRISP-DM process and reported with its limitations stated plainly.